
What is an employee engagement score?
An employee engagement score is a quantitative metric that captures how emotionally committed, motivated, and loyal your employees are to the organisation. Unlike a simple satisfaction rating, it measures discretionary effort — whether people go beyond their job description because they genuinely care. Organisations with highly engaged employees are 23% more profitable than those with low engagement. That single statistic explains why HR leaders and business owners treat this number as a core indicator of organisational health, not just a feel-good HR exercise.
What is an employee engagement score and how is it defined?
An employee engagement score is defined as a composite index built from survey responses that measure connection, commitment, and motivation at work. The industry standard term is the Employee Engagement Index, and you will see both phrases used interchangeably across HR platforms and research bodies. The score gives you a single number that represents the overall engagement level of your workforce at a point in time.
The Employee Engagement Index is built on four core survey statements: ambassadorship (would employees recommend the organisation as a great place to work?), discretionary effort (do they go above and beyond?), loyalty (do they plan to stay?), and pride (are they proud to work there?). Each statement targets a distinct dimension of engagement. Together, they produce a score that reflects the full picture of how your people feel about their work and their employer.

Engagement scores correlate directly with profitability, safety, and customer satisfaction. This means the number is not an HR vanity metric. It is a proxy for business performance, and treating it as such changes how leadership responds to the data.
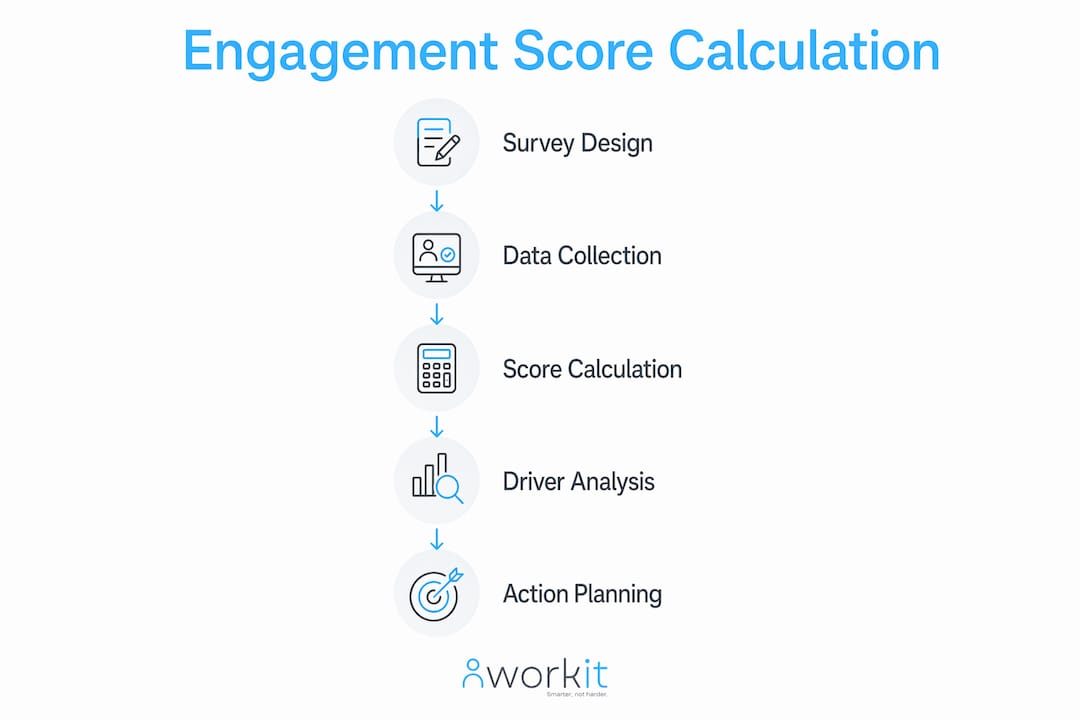
How is an employee engagement score calculated?
Two calculation methods dominate the field: mean average scoring and top-box scoring. Mean average takes all responses across a rating scale (typically 1–5 or 1–10) and divides by the number of respondents. Top-box scoring counts only the respondents who selected the highest favourable options, such as “strongly agree” or “agree,” and expresses that as a percentage of the total.
Top-box calculation is preferred over mean average because it separates genuinely engaged employees from a blended result that masks neutral or negative views. A mean score of 3.8 out of 5 sounds reasonable, but it could include a large group of disengaged employees dragged upward by a small group of highly engaged ones. Top-box scoring makes that split visible.
Pro Tip: Run your engagement survey at least twice per year. Annual surveys capture a moment in time; pulse surveys run quarterly or monthly give you trend data that reveals whether your initiatives are actually working.
Survey design matters as much as the calculation method. The four core statements (ambassadorship, discretionary effort, loyalty, and pride) should appear in every survey cycle without modification so you can track change over time. Additional questions can probe specific drivers, but the index statements must stay consistent.
Driver analysis via regression identifies which workplace factors most influence your engagement score. Common drivers include manager quality, role clarity, recognition, and career development. Knowing your drivers tells you where to invest, not just what the score is.
What counts as a good employee engagement score?
Industry benchmarks classify engagement scores into three broad bands. Scores of 80% and above indicate a highly engaged workforce. Scores between 65% and 79% sit in the moderate range, where engagement exists but has clear room to grow. Scores below 65% signal a disengagement risk that warrants immediate attention.
| Score range | Classification | Typical business signal |
|---|---|---|
| 80% and above | Highly engaged | Strong retention, high productivity |
| 65%–79% | Moderately engaged | Stable but improvement needed |
| Below 65% | Disengagement risk | Elevated turnover, lower output |
These bands are starting points, not verdicts. A professional services firm with 72% may be outperforming its industry peers, while a retail business at the same score may be lagging. Context always shapes interpretation.
“Engagement scores are starting points; understanding the drivers of change unlocks strategic value for HR. A score without driver analysis is a number without a plan.”
Benchmarks also vary by tenure and role type. New starters often score higher because they are still in the honeymoon phase of employment. Long-tenured employees in stagnant roles frequently score lower. Comparing your overall score to a global average without accounting for these variables leads to misleading conclusions.
What are the key employee engagement metrics related to the score?
The engagement score is the headline number, but it works best alongside a set of related HR metrics you should track to build a complete picture of workforce health. Relying on a single score is risky. A taxonomy of KPIs supported by behavioural metrics offers better insights and stronger leadership buy-in.
The most useful companion metrics include:
- Employee Net Promoter Score (eNPS): Asks employees how likely they are to recommend the organisation as a place to work, on a scale of 0–10. Promoters (9–10) minus detractors (0–6) gives you the eNPS. It is fast to collect and easy to benchmark.
- Voluntary turnover rate: The percentage of employees who choose to leave within a given period. High voluntary turnover is one of the clearest signals of disengagement, and replacing a single employee can cost up to $200,000.
- Absenteeism rate: Frequent unplanned absences often precede disengagement. Tracking this metric monthly reveals early warning signs before they show up in survey data.
- Pulse survey scores: Short, frequent surveys (3–5 questions) that track sentiment between full engagement cycles. They capture reactions to specific events like leadership changes or restructures.
- Recognition participation rate: The percentage of employees giving or receiving recognition in a given period. Low participation correlates with poor manager relationships and reduced discretionary effort.
Pro Tip: Pair your engagement score with performance management data to identify whether low-engagement teams also show declining output. That combination makes the business case for intervention far more persuasive to a CFO or CEO.
The critical distinction between engagement and satisfaction is worth stating clearly. Satisfaction measures whether employees are content with their conditions. Engagement measures whether they are motivated to contribute. A satisfied employee can still be disengaged. The two metrics serve different diagnostic purposes.
How should organisations interpret and apply engagement scores?
An engagement score becomes useful only when you act on what it reveals. The first step is segmentation. Segmenting scores by team, manager, and tenure reveals pockets of disengagement that company-wide averages conceal. A business with an overall score of 74% may have one department sitting at 52% and another at 88%. The average hides both problems and strengths.
Common pitfalls in applying engagement data include:
- Treating the score as a destination. A score of 80% is not the goal. Sustained improvement and understanding of what drives the score is the goal.
- Ignoring qualitative feedback. Open-text survey responses often contain the most specific and useful information. Quantitative scores tell you what; qualitative comments tell you why.
- Reporting only the top-line number to leadership. Executives need to see segment-level data and trend lines to make resourcing decisions. A single number without context rarely drives change.
- Skipping follow-through. Surveying employees and taking no visible action erodes trust faster than not surveying at all. Employees notice when nothing changes.
Engagement scores are lagging indicators. They reflect what has already happened in the workplace. To predict future disengagement, monitor leading behavioural signals: spikes in absenteeism, changes in timesheet patterns, and drops in recognition participation. These signals appear weeks or months before a survey captures the damage.
Combining score data with behavioural signals gives HR teams the ability to intervene early. That is where the real value of engagement measurement sits — not in the annual report, but in the early conversations it enables between managers and their teams.
Key takeaways
An employee engagement score is most valuable when paired with driver analysis, segmentation, and behavioural metrics — not treated as a standalone annual number.
| Point | Details |
|---|---|
| Core definition | An engagement score measures emotional commitment, discretionary effort, loyalty, and pride across your workforce. |
| Preferred calculation | Top-box scoring reveals genuine engagement more clearly than mean averages, which can mask disengagement. |
| Benchmark bands | Scores of 80%+ are highly engaged; 65%–79% are moderate; below 65% signals a disengagement risk. |
| Segmentation is critical | Company-wide averages hide local problems; always break scores down by team, manager, and tenure. |
| Lagging vs leading | Pair survey scores with behavioural signals like absenteeism and recognition rates to catch disengagement early. |
Why engagement scores deserve more respect than they get
Most organisations treat the engagement score as an annual HR ritual. A survey goes out, a number comes back, a slide deck gets presented to the executive team, and then the organisation waits another 12 months. That approach wastes the metric entirely.
What I have observed across years of working with HR teams is that the score itself is rarely the problem. The problem is what happens after the score lands. Teams that use engagement data well do three things differently. They segment immediately, they connect the score to business outcomes their CFO cares about (turnover cost, productivity, customer satisfaction), and they close the feedback loop with employees within 30 days of the survey closing.
The organisations that struggle treat engagement as an HR metric rather than a business metric. When a score drops, the conversation stays inside the HR team. When a score improves, it rarely gets credited in the same breath as revenue growth or customer retention. That disconnect is the real barrier to engagement measurement having strategic impact.
My honest recommendation: present your engagement data alongside your case study evidence of what changed when engagement improved. Numbers without stories rarely move leadership. Stories without numbers rarely survive budget conversations. You need both.
— Stephen
How Workit supports engagement tracking for Australian businesses
Workit is built for Australian HR teams who need to track engagement alongside every other workforce metric, without managing multiple disconnected systems.
Workit’s all-in-one platform brings engagement surveys, eNPS tracking, turnover reporting, and performance data into a single place at $5 per employee per month, with no hidden fees and no module lock-outs. You get the full picture of workforce health without the spreadsheet juggling. Australian businesses using Workit report faster insight cycles and clearer reporting for leadership teams. If you are ready to move from annual surveys to real-time workforce intelligence, book a Workit demo and see how the platform fits your team.
FAQ
What is an employee engagement score?
An employee engagement score is a composite metric that measures how emotionally committed, motivated, and loyal employees are to their organisation. It is typically built from survey statements covering ambassadorship, discretionary effort, loyalty, and pride.
What is a good employee engagement score?
A score of 80% or above is classified as highly engaged, 65%–79% as moderately engaged, and below 65% as a disengagement risk. These benchmarks vary by industry, so always compare your score against sector-specific data.
How often should you measure employee engagement?
Most organisations run a full engagement survey annually and supplement it with quarterly or monthly pulse surveys. More frequent measurement gives you trend data and allows earlier intervention when sentiment drops.
What is the difference between engagement and satisfaction scores?
Satisfaction measures whether employees are content with their working conditions. Engagement measures whether they are motivated to contribute beyond the minimum. An employee can be satisfied but still disengaged.
What affects an employee engagement score?
Driver analysis shows that manager quality, role clarity, recognition, and career development are the most common factors influencing engagement scores. Segmenting results by team and tenure reveals which drivers matter most in your specific context.