

HR reporting metrics every Australian HR team must track
The metrics that matter most for Australian HR teams right now are: time to hire, voluntary turnover rate, employee Net Promoter Score (eNPS), absenteeism rate, training completion rate, WHS incident frequency rate, cost per hire, and headcount vs FTE variance. Together, these eight cover recruitment efficiency, workforce stability, engagement, wellbeing, capability, safety, and cost — the full picture your executive team needs to make decisions. Your practical next step this week: pull baseline values for each metric from your payroll and HRIS systems, even if the numbers are rough. You cannot improve what you have not measured.
- Recruitment: Time to hire, cost per hire, offer acceptance rate
- Retention and turnover: Voluntary turnover rate, retention rate
- Engagement and wellbeing: eNPS, absenteeism rate
- Performance and productivity: Performance review completion rate, internal promotion rate
- Learning and development: Training completion rate, training ROI
- WHS: Lost time injury frequency rate (LTIFR), WHS audit completion rate
- HR operations and cost: Cost per hire, headcount vs FTE variance, HR cost as % of revenue
Pro Tip: Before you build a dashboard, run a single query across your payroll or HRIS to get headcount, FTE, and voluntary separations for the last 12 months. Those three numbers give you a baseline for turnover, FTE variance, and cost analysis — the foundation every other metric builds on.
Key takeaways
Tracking the right HR reporting metrics — and linking each one to a clear owner, a business question, and a compliance obligation — is what separates HR teams that influence decisions from those that merely produce reports.
| Point | Details |
|---|---|
| Start with eight priority metrics | Cover recruitment, retention, engagement, WHS, and HR cost before adding complexity. |
| Use the three-level reporting model | Descriptive, diagnostic, and predictive reporting serve different audiences and decisions. |
| WGEA applies at 100+ employees | Report against all six Gender Equality Indicators annually, with CEO sign-off and employee publication. |
| Fair Work requires seven-year retention | Keep prescribed employee records for seven years; issue pay slips within one working day of payday. |
| Workit centralises reporting and compliance | One platform covers WGEA exports, Xero payroll integration, audit trails, and real-time dashboards at $5 per employee per month. |
Table of Contents
- What are HR reporting metrics and what does good reporting look like?
- How do you choose the right HR metrics for your organisation?
- Essential HR reporting metrics: formulas, data sources, and visuals
- How do you build HR reports and dashboards that people actually use?
- What are the Australian legal requirements for HR reporting?
- Data governance and calculation pitfalls to avoid
- What tool types support HR reporting in Australia?
- What people-analytics trends should Australian HR teams watch?
- The metrics that matter most are the ones that change behaviour
- Workit gives Australian HR teams real-time reporting without the manual work
- Sources
- FAQ
What are HR reporting metrics and what does good reporting look like?
HR reporting metrics are quantitative measures that tell you what is happening in your workforce, why it is happening, and what is likely to happen next. A metric on its own is just a number. A metric in context — compared to a prior period, a benchmark, or a business target — becomes a signal you can act on.
Good HR reporting operates at three levels, and most Australian HR teams need all three.
Descriptive reporting answers “what happened?” Headcount at end of month, voluntary turnover for the quarter, training hours delivered — these are the baseline. They are the foundation of every compliance report and the starting point for any conversation with a people leader.
Diagnostic reporting answers “why did it happen?” If turnover spiked in one business unit, a diagnostic lens cross-references exit interview themes, engagement scores, and manager tenure to surface the likely cause. This is where people analytics KPIs start earning their keep.
Predictive reporting answers “what is likely to happen?” It uses patterns in overtime hours, internal mobility rates, and engagement trends to flag flight risk before resignations land. Most Australian HR teams are still building the data foundations to do this well, but the shift is underway.
Cadence and audience shape everything. The Victorian Public Sector Commission’s people metrics dictionary — which covers 47 measures with formulas — promotes a “measurement menu” approach: pick what is relevant to your priorities, not a fixed list. That principle applies to reporting frequency too.
Executive audiences want three to five trend metrics and one recommended action per report. People managers want team-level data on attendance, performance, and engagement. HR operations teams need the full operational picture: FTE reconciliation, leave liability, compliance completion rates, and audit trails.
How do you choose the right HR metrics for your organisation?
The most common mistake in HR reporting is tracking what is easy to pull rather than what is worth knowing. A decision framework fixes that.
A four-step framework for metric selection
- Start with the business goal. What is the organisation trying to achieve this year? Growth, cost reduction, capability uplift, safety improvement? Each goal points to a different metric set.
- Define the question the metric must answer. “Are we retaining our top performers?” is a better starting point than “let’s track turnover.” The question shapes the formula, the segmentation, and the threshold that triggers action.
- Assign an owner and a cadence. A metric without an owner is never updated. A metric without a cadence is never acted on. Assign both before you add anything to a dashboard.
- Vet it against five criteria: Is it actionable (can someone do something with it)? Is it reliable (is the data clean and consistent)? Is it comparable (can you benchmark it)? Is it aligned (does it connect to a strategic priority)? Is it ethical (does it respect employee privacy and avoid proxy discrimination)?
The Subscribe HR practitioner checklist groups 15 workforce analytics metrics into foundational, strategic, and compliance categories — a useful cross-check when you are deciding what to include.
Audience and cadence guide
Different audiences need different views at different frequencies. Here is a practical mapping:
Executive leadership — monthly or quarterly. Focus on voluntary turnover rate, eNPS trend, headcount vs budget, cost per hire, and LTIFR. One-page summary with three trend charts and one recommended action.
People managers — monthly. Team-level absenteeism, performance review completion, training completion, and open role tenure. Delivered as a team dashboard or a short automated report.
HR operations — weekly or fortnightly. FTE reconciliation, leave liability, compliance completion rates, onboarding completion, and incident reporting status. Operational and audit-ready.
Essential HR reporting metrics: formulas, data sources, and visuals
The table below covers the core metrics by functional area. For each one, the formula is the version most Australian HR teams can calculate from standard payroll and HRIS data.
| Metric | Formula | Data source | Recommended visual |
|---|---|---|---|
| Time to hire | Date offer accepted minus date job posted (calendar days) | ATS, HRIS | Bar chart by role/level |
| Cost per hire | (Internal + external recruiting costs) ÷ number of hires | Payroll, finance | Bar chart by period |
| Offer acceptance rate | (Offers accepted ÷ offers made) × 100 | ATS | Trend line |
| Voluntary turnover rate | (Voluntary separations ÷ average headcount) × 100 | HRIS, payroll | Trend line by BU |
| Retention rate | ((Headcount end – new hires) ÷ headcount start) × 100 | HRIS | Trend line |
| Absenteeism rate | (Unplanned absence days ÷ total scheduled days) × 100 | Payroll, leave system | Heat map by team/month |
| eNPS | % promoters minus % detractors (from pulse survey) | Engagement platform | Gauge or trend line |
| Performance review completion | (Reviews completed ÷ reviews due) × 100 | HRIS, performance module | Stacked bar by BU |
| Training completion rate | (Completions ÷ enrolments) × 100 | LMS | Bar chart by course/team |
| Training ROI | (Net benefit of training ÷ total training cost) × 100 | Finance, LMS | Scorecard |
| LTIFR | (Lost time injuries × 1,000,000) ÷ hours worked | WHS/incident system | Trend line |
| WHS audit completion | (Audits completed ÷ audits scheduled) × 100 | WHS system | Stacked bar |
| Headcount vs FTE | Actual FTE ÷ budgeted FTE (ratio) | Payroll, HRIS | Variance chart |
| HR cost as % of revenue | Total HR costs ÷ total revenue × 100 | Finance, payroll | Trend line |
Recruitment metrics
Time to hire is the most-watched recruitment metric because it directly affects candidate experience and hiring manager satisfaction. The clock starts when the job is posted, not when the recruiter begins sourcing — a distinction that frequently inflates reported figures. Cost per hire should include recruiter time (at an hourly rate), job board fees, agency fees, and onboarding costs for a complete picture.
Retention and turnover
Voluntary turnover rate is the single most important retention metric. Calculate it using average headcount (headcount at start plus headcount at end, divided by two) as the denominator, not end-of-period headcount alone. Segmenting by business unit, tenure band, and manager reveals patterns that a single organisation-wide figure hides. Australian SME benchmarks show turnover rates vary significantly by organisation size, so always compare against like-for-like peers rather than a single national average.
Pro Tip: Track “regrettable turnover” separately — departures of high performers or hard-to-replace roles. A low overall turnover rate can mask a serious talent loss problem if the people leaving are your best.
Engagement and wellbeing
eNPS (employee Net Promoter Score) is calculated by subtracting the percentage of detractors (scores 0–6) from the percentage of promoters (scores 9–10) on a single “would you recommend this organisation as a place to work?” question. It is fast to collect and easy to trend. Absenteeism rate is a leading indicator of engagement problems — a sustained rise in unplanned absences in a team often precedes a turnover spike by two to three months.
WHS metrics: lead and lag
Safe Work Australia recommends structuring WHS KPIs into lead indicators (training completion, audit completion, hazard reports closed) and lag indicators (LTIFR, workers’ compensation claims). Relying on injury counts alone misses the prevention story. A WHS dashboard should show both what you are doing to prevent incidents and what the outcome data tells you about whether it is working.
HR operations and cost
FTE vs headcount is one of the most commonly miscalculated metrics. The APSC common workforce metrics guidance defines FTE as the ratio of contracted hours to standard full-time hours — a 0.6 FTE employee counts as 0.6, not 1.0 in headcount terms. Mixing FTE and headcount in the same calculation produces figures that cannot be compared across periods or organisations.
How do you build HR reports and dashboards that people actually use?
A dashboard nobody reads is just a maintenance burden. The difference between a report that drives decisions and one that gets filed comes down to structure, visual choice, and how well it matches the audience’s actual question.
A reusable report template
Use this checklist for every report you build:
- Audience — who is this for and what decision are they making?
- Purpose — one sentence: what question does this report answer?
- Top 3–5 KPIs — the metrics that directly answer the question, with current value, prior period, and trend direction.
- Context notes — one line per metric explaining any anomaly, data quality caveat, or external factor.
- Data owner — who is responsible for the accuracy of each metric?
- Update frequency — when does this report refresh and who triggers it?
- Recommended action — one clear next step based on what the data shows.
Visual choices that work
Trend lines suit any metric you want to watch over time: turnover, absenteeism, eNPS. They make direction obvious at a glance. Stacked bar charts work well for completion metrics (training, performance reviews) broken down by business unit or team. Heat maps are the best choice for absenteeism by team and month — patterns jump out immediately. Cohort analysis is the right tool for retention: track the percentage of each hire cohort still employed at 3, 6, 12, and 24 months. Distribution charts suit salary equity and performance rating analysis, where you want to see spread, not just averages.
For executive HR reporting, the format that consistently gets read is a single page with three trend metrics, one variance callout, and one recommended action. Anything longer risks the key insight being buried.
Pro Tip: When preparing an executive summary, lead with the metric that has moved most significantly since last period — up or down. Executives scan for change, not confirmation. Put the stable metrics in an appendix.
What are the Australian legal requirements for HR reporting?
Australian HR teams face firm reporting obligations under three frameworks. Getting these wrong is not just a compliance risk — it affects your organisation’s public standing and your ability to attract talent.
WGEA reporting
Employers with 100 or more employees are required to report annually to the Workplace Gender Equality Agency. WGEA defines six Gender Equality Indicators (GEIs) — workforce composition, governing body composition, equal remuneration, flexible working arrangements, employee consultation, and responses to sexual harassment or discrimination — and provides formulaic definitions for each.
Compliance requires lodging an annual Gender Equality Report within the two-month lodgement window, securing CEO sign-off, and making public and employee-facing documents available. Employers who meet all requirements become eligible for a WGEA certificate of compliance. The WGEA Data Explorer is also worth bookmarking — it lets you benchmark your GEI results against industry peers.
Fair Work recordkeeping
Under the Fair Work Act, employers must retain prescribed employee records — including hours worked, wages paid, and superannuation details — for seven years. Pay slips must be issued within one working day of payday. Electronic pay slips are acceptable provided they contain the same mandatory details as hard copies. This seven-year retention rule directly shapes your data governance policy: records must be kept in a format that is retrievable and auditable for the full period.
WHS reporting
Safe Work Australia’s guidance on measuring and reporting on work health and safety recommends structuring WHS KPIs into lead and lag indicators and warns against relying on single injury metrics. Your WHS reporting cadence should include monthly lead indicators (training completion, hazard close-out rates) and quarterly lag indicators (LTIFR, workers’ compensation frequency).
Regulatory compliance checklist
- [ ] Confirm employee count: are you at or above 100 employees and therefore a relevant WGEA employer?
- [ ] Map your six GEIs and confirm data sources for each (payroll, HRIS, board records)
- [ ] Schedule WGEA lodgement window in your HR calendar and assign a report owner
- [ ] Confirm CEO sign-off process and employee-facing publication steps
- [ ] Audit your Fair Work recordkeeping: are all prescribed fields captured and retained for seven years?
- [ ] Confirm pay slip issuance is within one working day of payday
- [ ] Review WHS reporting: do you have both lead and lag indicators in your current dashboard?
- [ ] Check registered organisation obligations if applicable under the Fair Work Commission’s financial reporting guidance
Statistic callout: Employers with 100 or more employees in Australia must report against all six WGEA Gender Equality Indicators annually — missing the lodgement window or failing CEO sign-off requirements means the organisation is not eligible for a certificate of compliance.
Data governance and calculation pitfalls to avoid
Reliable HR reporting depends on clean data. A metric calculated differently by two people in the same team is not a metric — it is a source of confusion.
Data quality rules
Four rules keep HR data trustworthy:
- Single source of truth: every metric draws from one authoritative system. Headcount comes from the HRIS, not a spreadsheet maintained by a business unit.
- Timestamping: every record change is logged with a date, time, and user ID. This is non-negotiable for Fair Work audit readiness.
- Version control: reports are versioned so you can reproduce any prior period’s figures exactly.
- Field-level definitions: every metric has a written definition specifying inclusions, exclusions, and the calculation window. “Turnover” means nothing without knowing whether it includes casuals, fixed-term contracts, and internal transfers.
Ownership and retention
| Role | Responsibility | Example |
|---|---|---|
| Metric owner | Defines the metric, sets thresholds, acts on results | HR Business Partner for turnover |
| Data steward | Maintains data quality in the source system | Payroll Manager for FTE data |
| Report approver | Signs off on accuracy before distribution | HR Director for executive reports |
The Fair Work seven-year retention rule applies to prescribed employee records. An integrated HRIS that timestamps records and prevents unauthorised edits is the most practical way to meet this obligation without manual archiving.
Common calculation pitfalls
FTE vs headcount confusion is the most frequent error. As the APSC workforce metrics guidance makes clear, FTE and headcount are not interchangeable. A team of 10 people working part-time may have an FTE of 6.5. Using headcount in a cost-per-FTE calculation produces a figure that understates the true cost.
Casual and contractor inclusion is the second common trap. Decide upfront whether casuals and labour-hire contractors are included in your turnover and headcount calculations, and apply that rule consistently. Changing the inclusion rule mid-year makes trend comparisons meaningless.
Date-window mismatches occur when one report counts separations in the calendar month and another counts them in the pay period. Standardise on one window — calendar month is the most common — and document it.
What tool types support HR reporting in Australia?
No single tool does everything well. Most Australian HR teams use a combination of systems, and the quality of reporting depends heavily on how well those systems connect.
Common tool types and their reporting role
- Payroll and STP systems (e.g., Xero) are the source of truth for wages, hours, leave balances, and FTE. Single Touch Payroll data maps directly to ATO categories, which makes month-end reconciliation more reliable when pay items are correctly classified.
- HRIS platforms hold employee records, position data, performance reviews, and onboarding status. An all-in-one HRIS that integrates payroll eliminates the manual reconciliation that causes most FTE calculation errors.
- Learning Management Systems (LMS) track enrolments, completions, and assessment results — the raw data for training completion rate and training ROI.
- Applicant Tracking Systems (ATS) capture time to hire, source of hire, and offer acceptance rate. Without an ATS, these figures are typically estimated from email timestamps, which introduces significant error.
- WHS and incident management systems are the source for LTIFR, near-miss rates, and audit completion. High-risk industries like construction benefit from purpose-built WHS modules integrated with the broader HR platform.
- BI tools (Power BI, Tableau, Looker) sit on top of these systems and pull data via API or scheduled extract for cross-system dashboards.
Integration checklist
Before you build any report, confirm these integration foundations are in place:
- Single canonical employee ID used across payroll, HRIS, LMS, and ATS
- Pay items mapped to ATO STP categories in your payroll system
- Automated leave balance extract scheduled at least weekly
- FTE calculation confirmed as contracted hours ÷ standard full-time hours (not headcount)
- Role and cost-centre hierarchy consistent across all systems
- Data extract timestamps recorded so you can identify stale data
Getting to a minimum viable report in 30–60 days
Start with three reports: a monthly headcount and FTE reconciliation, a quarterly turnover report segmented by business unit, and a monthly WHS lead/lag dashboard. These three cover compliance, operational hygiene, and safety — the non-negotiables. Add engagement and performance metrics in month two once the data foundations are stable.
What people-analytics trends should Australian HR teams watch?
The direction of travel for Australian HR teams is clear: away from descriptive reporting and towards early-warning indicators that let leaders act before problems become expensive.
The most significant shift is the move from tracking what happened to predicting what is about to happen. Overtime spikes, internal mobility slowdowns, and declining eNPS scores are now being used as leading indicators of turnover risk — not just interesting data points. Teams that have built clean, consistent data foundations over the past two to three years are now in a position to pilot simple predictive models.
Three practical pilots worth running in the next quarter:
- Predictive turnover model: use tenure, engagement score, and recent absenteeism trend to flag employees at elevated flight risk. Even a simple scoring model built in a spreadsheet adds value if the data is clean.
- Skills proficiency score: map training completion and assessment results to role competency frameworks to identify capability gaps before they affect performance.
- eNPS cadence tightening: shift from annual engagement surveys to quarterly pulse eNPS. The trend line across four quarters tells you far more than a single annual score.
On benchmarking: Australian SME-focused analysis confirms that turnover and absenteeism benchmarks vary significantly by organisation size. A small business with 15 employees should not benchmark against a national average that includes large enterprises. Use the WGEA Data Explorer for gender equality benchmarks, the APSC metrics documents for public sector comparisons, and industry association data for sector-specific turnover norms.
The metrics that matter most are the ones that change behaviour
There is a version of HR reporting that exists purely to satisfy a reporting cycle. Numbers go in, a PDF goes out, and nothing changes. Most HR teams have been there at some point.
The shift happens when you stop asking “what should we measure?” and start asking “what decision does this metric need to support?” That reframe changes everything — which metrics you track, how you present them, and who you put them in front of.
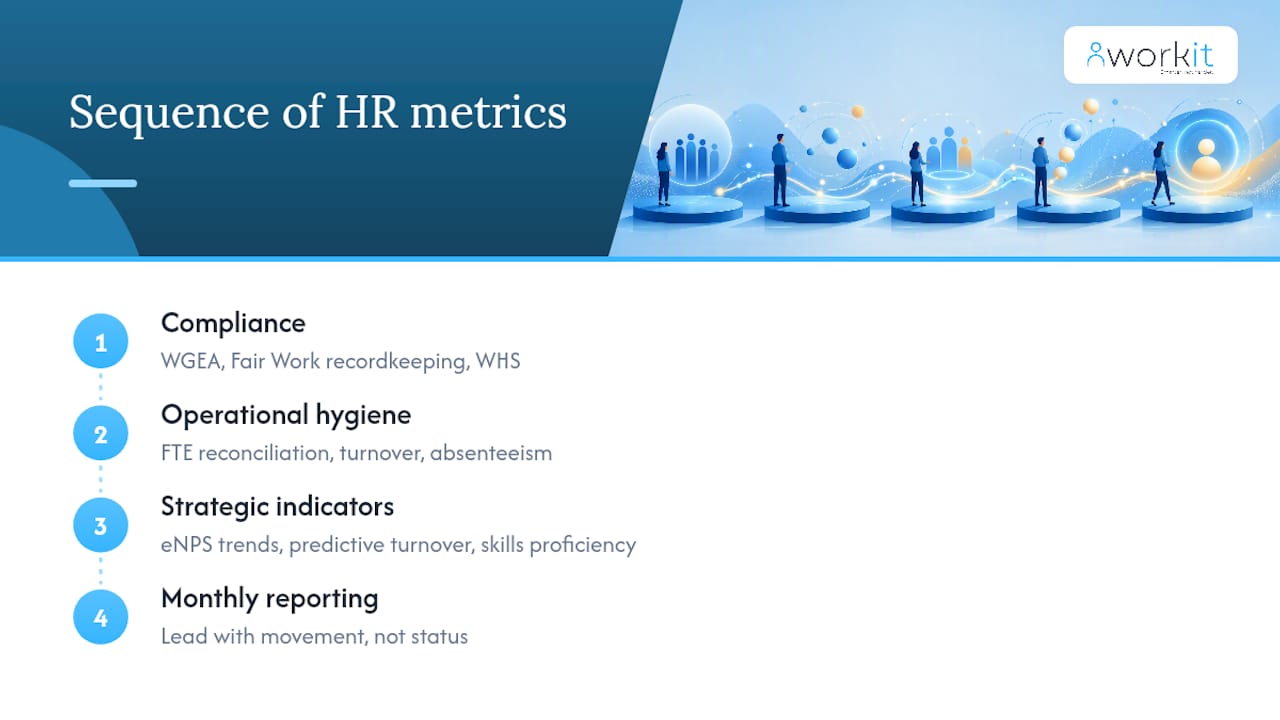
My practical rule of thumb for sequencing: start with compliance (WGEA, Fair Work recordkeeping, WHS), then move to operational hygiene (FTE reconciliation, turnover, absenteeism), then build towards strategic indicators (eNPS trends, predictive turnover, skills proficiency). Trying to do all three at once usually means none of them get done well.
When preparing a monthly executive report, the one habit that makes the biggest difference is leading with movement, not status. Instead of “turnover is 14%,” write “turnover increased 2.3 percentage points this quarter, driven by voluntary departures in the customer service team.” That sentence tells the executive what changed, where, and implicitly, that someone needs to investigate. Status is forgettable. Movement triggers action.
Workit gives Australian HR teams real-time reporting without the manual work
Pulling together reliable HR reporting metrics across payroll, compliance, and engagement is exactly the problem Workit was built to solve for Australian businesses. Instead of reconciling data across disconnected systems, you get one platform where headcount, FTE, leave balances, onboarding status, compliance completions, and incident records all live together — and update in real time.
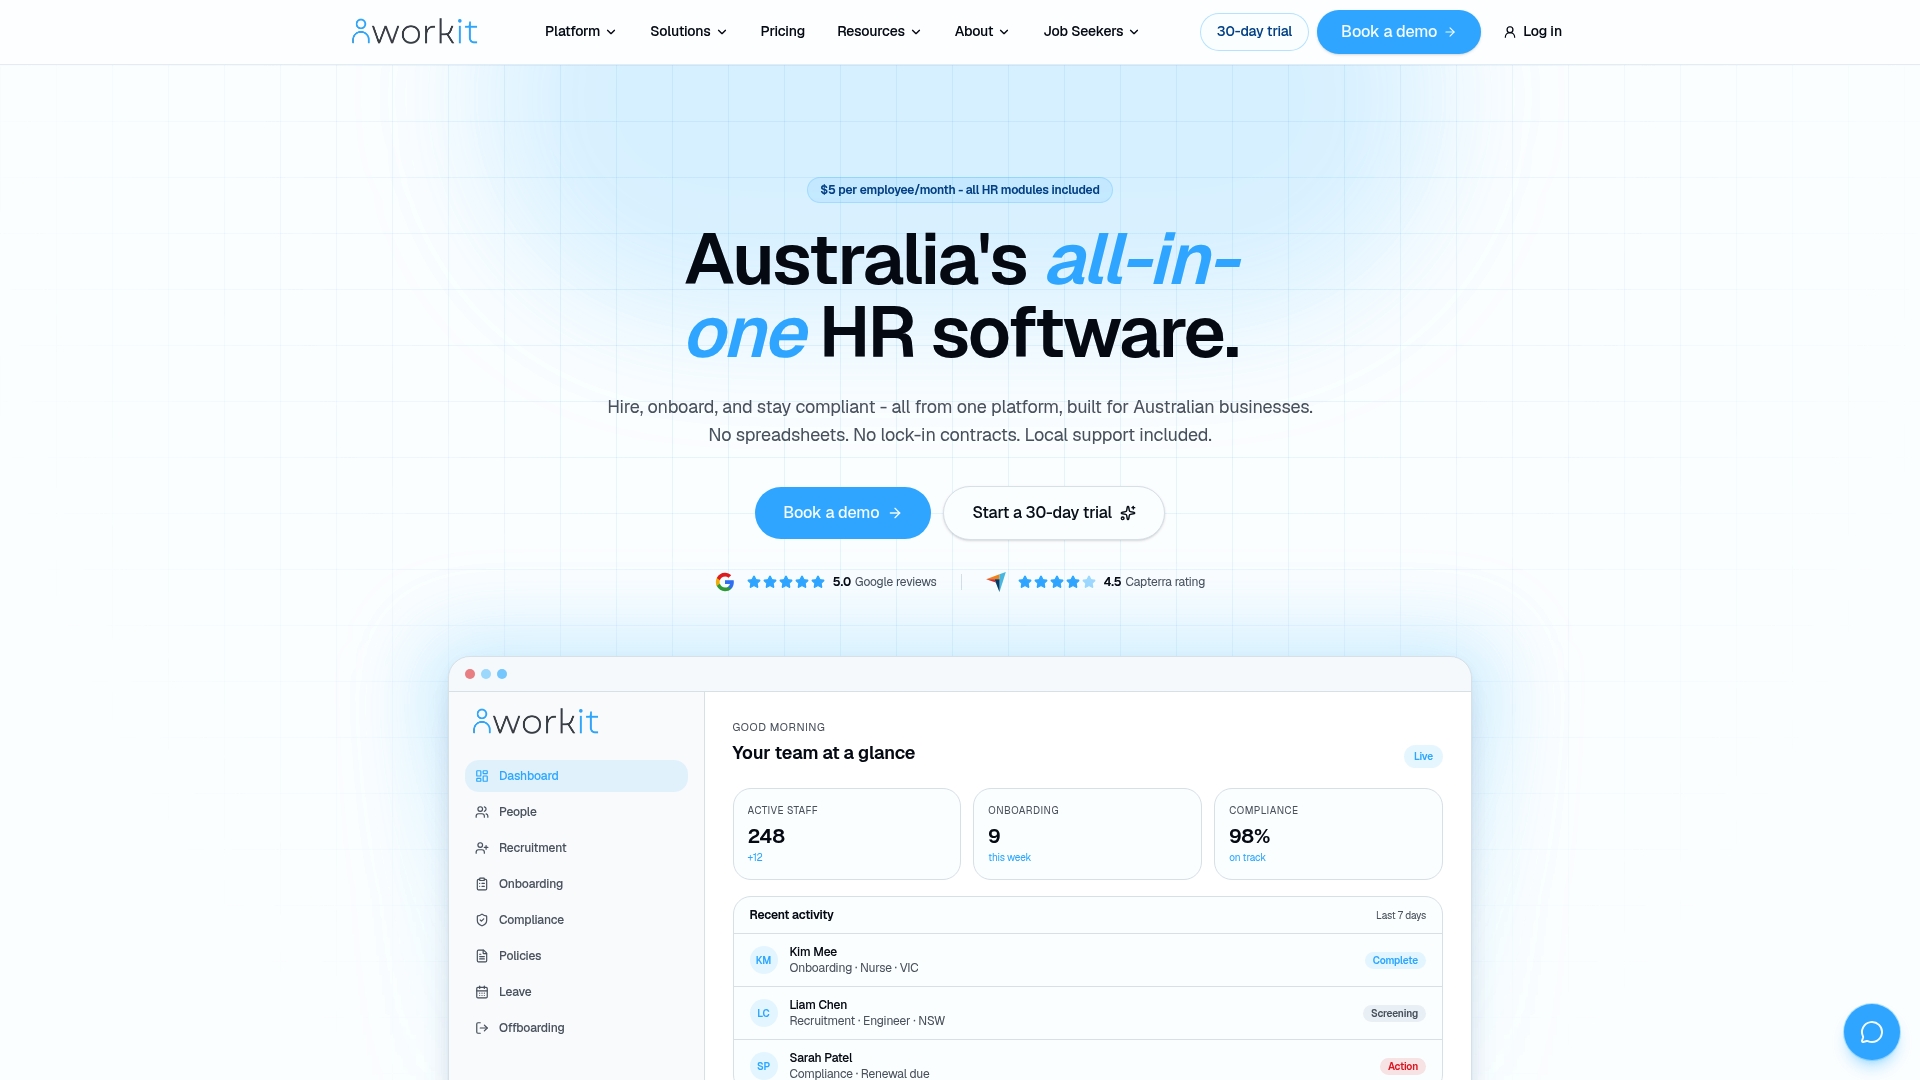
Workit’s reporting module covers the metrics this guide recommends: WGEA-ready exports for your Gender Equality Indicators, payroll integration with Xero for accurate FTE and leave data, automated audit trails that satisfy the Fair Work seven-year retention requirement, and configurable dashboards for executive, people manager, and HR ops audiences. Pricing is transparent at $5 per employee per month, with every module included — no add-ons required for compliance or reporting features.
If you are ready to move from spreadsheets to a reporting setup that is audit-ready and built for Australian compliance, book a demo with the Workit team and see how quickly you can get your first minimum viable dashboard live.
Sources
Primary Australian sources used in this guide:
- Gender equality indicators for companies reporting to WGEA
- Record-keeping and pay slips fact sheet - Fair Work Ombudsman
- People metrics dictionary — VPSC
- Measuring and reporting on work health and safety — Safe Work Australia
- Common workforce metrics — APSC
- Financial reporting obligations — Fair Work Commission
FAQ
What are the most important HR reporting metrics for Australian businesses?
The eight highest-priority metrics are time to hire, voluntary turnover rate, eNPS, absenteeism rate, training completion rate, LTIFR, cost per hire, and headcount vs FTE variance. These cover recruitment, retention, engagement, safety, and cost in a single reporting set.
Which Australian employers must report to WGEA?
Employers with 100 or more employees are required to report annually to WGEA against six Gender Equality Indicators. Reports must be lodged within the two-month lodgement window with CEO sign-off and employee-facing publication.
How long must Australian employers keep HR records?
Under the Fair Work Act, prescribed employee records — including hours worked, wages, and superannuation details — must be retained for seven years. Pay slips must be issued within one working day of payday.
What is the difference between headcount and FTE?
Headcount counts the number of individual employees regardless of hours worked. FTE (full-time equivalent) calculates the ratio of contracted hours to standard full-time hours, so a part-time employee working 0.6 of standard hours counts as 0.6 FTE, not 1.0. Mixing the two in calculations produces unreliable results.
How can Workit help with HR reporting and compliance in Australia?
Workit provides real-time dashboards, WGEA-ready exports, Xero payroll integration, and automated audit trails that meet Fair Work retention requirements — all in one platform at $5 per employee per month, with no separate compliance add-ons required.