

HR software ROI: the formula and calculator you need
HR software ROI comes down to one formula: ROI (%) = (Net benefit ÷ Total cost) × 100, where net benefit is total quantified gains minus total cost. Pair it with Payback period (months) = Total cost ÷ Average monthly net benefit to show how fast the investment pays for itself.
A credible result for most mid-sized HR system deployments lands within a moderate range over a typical period of one to three years, with payback expected within about a year to year and a half. Anything wildly higher usually means someone has counted a benefit twice or assumed 100% staff adoption from day one.
- Net benefit = total dollar value of gains (time saved, errors avoided, faster hiring) minus total cost
- Total cost = licence fees + implementation + training + ongoing support, one-off and recurring combined
- A practical ROI workflow lists costs and benefits before you touch a calculator, not after
Pro Tip: Treat intangible benefits like employee engagement as supporting narrative, not a line item in your dollar figure. Mixing hard and soft numbers in one ROI percentage is the fastest way to lose credibility with your CFO.
Key Takeaways
HR software ROI is calculated as net benefit divided by total cost, and a credible result depends on fully loaded rates, phased adoption assumptions and honest scenario modelling.
| Point | Details |
|---|---|
| Use the standard formula | ROI (%) = (Net benefit ÷ Total cost) × 100, paired with payback period in months. |
| Value time correctly | Apply a fully loaded hourly rate with a 40 to 50% uplift, never base salary alone. |
| Model three scenarios | Build conservative, base and optimistic cases instead of assuming full efficiency gains. |
| Capture the full baseline | Gather admin hours, turnover, payroll errors and time-to-hire over 6 to 12 months before you start. |
| Simplify with transparent pricing | Workit’s $5 per employee per month model and built-in reporting make TCO and ROI easier to track and present. |
Table of Contents
- What does HR software ROI actually measure?
- How do you calculate HR software ROI step by step?
- What costs should you include in your total cost of ownership?
- What savings can you realistically convert to dollars?
- What baseline data do you need before you calculate anything?
- How does an HR software ROI calculator work?
- How do you present ROI results to stakeholders?
- What mistakes most often undermine an HR software ROI calculation?
- Worked examples: small business and mid-sized organisation
- How Workit makes HR software ROI easier to measure
- Why most HR software ROI numbers don’t survive the boardroom
- Get a clearer path to measurable HR software ROI
- Sources
- FAQ
What does HR software ROI actually measure?
HR software ROI measures whether the money and time you put into a system generates more value back than it costs. That value shows up in four buckets: costs avoided (fewer errors, less compliance risk), efficiency gains (hours freed up), productivity impacts (faster hiring, quicker time-to-competency), and risk avoidance (fines, disputes, audit failures).
Some of that is easy to put a number on. Some isn’t, and pretending otherwise is where most ROI calculations fall apart.
KPIs worth tracking:
- HR admin hours spent on manual tasks (data entry, filing, chasing approvals)
- Time-to-hire and cost-per-hire
- Onboarding time to full productivity
- Payroll error rate and correction time
- Turnover rate and absenteeism
- Manager time spent on HR admin instead of their actual job
- Software adoption rate (logins, self-service usage, workflow completion)
Direct KPIs (admin hours, payroll errors, time-to-hire) convert to dollars cleanly because they’re tied to a rate and a volume. Indirect KPIs (engagement, culture, employer brand) matter, but they belong in the qualitative section of your business case, not folded into your headline ROI percentage. Track them separately on a dashboard of HR metrics so leadership sees the full picture without the two categories bleeding into one number.
How do you calculate HR software ROI step by step?
Building a defensible model isn’t complicated, but it does need to be done in order. Skip a step and the number you present will fall apart under the first hard question from finance.
- Define your timeframe and objectives. Most organisations model over 12 to 36 months. Twelve months suits smaller deployments with quick wins (onboarding, self-service); 36 months suits larger platform rollouts where integration and change management take longer to pay off.
- Establish baseline metrics. Before you can claim an improvement, you need the current-state number. How many hours does your team spend on manual leave approvals right now? What’s your actual cost-per-hire today? Guessing here undermines everything that follows.
- List and value expected improvements. For each KPI, estimate the realistic change and convert it to dollars using a loaded hourly rate (more on that below).
- Include all costs, one-off and recurring. Licence fees are the easy part. Implementation, data migration, training hours and the productivity dip during cutover all belong in the model too.
- Calculate net benefit, ROI %, and payback period. Subtract total cost from total quantified benefit, then run both formulas.
- Run scenario checks and document your assumptions. Model a conservative, base, and optimistic case, and write down every assumption you made so someone else can audit it in five minutes.
On timeframes: shorter windows (under 12 months) tend to understate ROI because benefits like reduced turnover and faster hiring take a full annual cycle to show up properly. If you’re presenting to a board that wants a three-year view, discount later-year benefits slightly to account for uncertainty, particularly around adoption and process change holding steady.
Document every assumption in plain language next to the number it drives: “80% self-service adoption by month six,” “20% reduction in payroll correction time,” “phased rollout across three business units.” A strong business case links each assumption to a leadership priority rather than presenting a bare number and hoping it’s convincing on its own.
Pro Tip: Build your model in three tabs, conservative, base, and optimistic, rather than three separate spreadsheets. When someone challenges an assumption in the meeting, you can flip tabs live instead of promising to “get back to them.”
What costs should you include in your total cost of ownership?
Total cost of ownership is where most ROI calculations quietly go wrong. Teams remember the subscription fee and forget everything that surrounds it.
Direct costs:
- Licence or subscription fees (monthly or annual)
- Implementation and setup fees
- Data migration from legacy systems or spreadsheets
- Integration costs (payroll, accounting, single sign-on)
- Third-party connectors or add-on modules
Internal costs:
- Project management hours across HR, IT and finance
- Training time for HR staff, managers and employees
- Change management activities (communications, workshops)
- Data cleansing before migration
- Opportunity cost of staff time diverted during cutover
Ongoing and hidden costs:
- Support fees beyond the base contract
- Customisation and configuration changes
- Maintenance and periodic upgrades
- Additional modules added after go-live
- Licence escalators tied to headcount growth
Treat one-off costs (implementation, migration, initial training) separately from recurring costs (subscription, support) in your model. A common mistake is amortising implementation cost evenly across three years when the business actually needs to see the full cash outlay in year one. Finance teams notice the difference immediately.
What savings can you realistically convert to dollars?
Some benefits monetise cleanly. Others need a more conservative hand. Start with the ones you can defend line by line.
Operational savings:
- HR admin hours saved: (hours saved per week × fully loaded hourly rate × 52 weeks)
- Manager time reclaimed from approvals, chasing paperwork and manual scheduling
- Payroll correction time saved, valued at the hourly rate of whoever fixes the errors
Talent and onboarding benefits:
- Reduced time-to-hire, valued against the cost of an open role staying vacant
- Lower cost-per-hire from more efficient recruitment workflows
- Faster time-to-productivity for new starters, often the single biggest hidden saving in a well-run onboarding process
Risk and compliance benefits:
- Avoided fines from missed compliance deadlines, modelled conservatively using historical incident rates, not worst-case scenarios
- Fewer payroll corrections, each one costed at admin time plus any goodwill payment
- Reduced exposure to disputes or litigation from better record-keeping and audit trails
Always value time using a fully loaded hourly rate, not base salary. That means including payroll tax, superannuation and overhead, which typically adds 40 to 50% on top of base wage. Skip this step and every dollar figure in your model is understated.
Pro Tip: When a benefit is genuinely hard to quantify, engagement, culture, employer brand, present it as strategic value on a separate slide rather than forcing a dollar figure onto it. A credible “we also expect improved engagement, measured via quarterly pulse surveys” beats a made-up percentage every time.
What baseline data do you need before you calculate anything?
Your ROI is only as good as the baseline you measure it against. Gather these numbers before you build a single formula.
Baseline checklist:
- Total employee count and headcount by department
- Average fully loaded salary (or a blended organisational rate)
- Current HR admin hours by task (leave requests, onboarding paperwork, contract variations)
- Time-to-hire, measured from role approval to start date
- Turnover rate, ideally split voluntary versus involuntary
- Payroll errors per pay cycle and the average time to correct each one
- Average cost of a vacant role per week
- Onboarding hours from day one to full competency
Use six to twelve months of historical data for recurring tasks like admin hours and payroll errors, and a full twelve months for recruitment and turnover figures. Shorter windows get skewed by seasonal hiring spikes or a one-off compliance audit that inflated admin hours for a fortnight.
Pull this data from payroll exports, timesheets, HR service desk ticket counts, ATS recruitment reports and finance reports. Where the numbers look off, a short interview with two or three managers usually explains the anomaly faster than another spreadsheet pivot.
How does an HR software ROI calculator work?
A calculator does the same maths you’d do manually, just faster and with fewer transcription errors. The inputs matter more than the tool itself.
Standard calculator inputs:
- Employee count
- Loaded hourly rate for HR staff and for managers (these differ)
- Hours saved per process, per week or per month
- Licence and implementation costs
- Expected adoption rate by quarter (rarely 100% in month one)
- Assumed turnover improvement percentage
- Assumed payroll error reduction percentage
The spreadsheet annualises the time savings, multiplies by the loaded rate, subtracts total annual cost, then outputs ROI % and payback in months. Run it three times: once with conservative adoption and modest error reduction, once with your realistic base case, and once optimistic. Multiplying hours saved by a loaded labour rate produces the clearest, most defensible dollar figure for both HR and manager time.
Before you present the output, sanity-check the inputs: does your assumed adoption rate match what similar rollouts actually achieved? Is your loaded rate consistent across every calculation in the model? A calculator is only as trustworthy as the numbers you feed it.
Pro Tip: Keep a “sources” column next to every input cell in your spreadsheet, payroll export, ATS report, finance system, so anyone reviewing the model can trace a number back to where it came from in under a minute.
How do you present ROI results to stakeholders?
The order you present in matters almost as much as the number itself. Finance and leadership want the headline first, then the evidence.
Recommended slide order:
- Executive summary: headline ROI % and payback period, one slide, no clutter
- The baseline problem: what’s broken today, in numbers
- Quantified benefits and the assumptions behind them
- Scenario table (conservative, base, optimistic)
- Project costs and implementation timeline
- KPIs and how you’ll measure them post go-live
Use a payback chart, a simple sensitivity table showing how ROI shifts if adoption comes in lower than expected, and one slide dedicated entirely to your data sources and assumptions. A short executive summary with headline ROI, payback months and a conservative downside scenario lands better with leadership than a dense fifteen-slide deck.
Stakeholders care most about payback months, the ROI percentage, and your adoption targets. If someone asks for net present value, have it ready as an appendix slide rather than building your whole narrative around it.
What mistakes most often undermine an HR software ROI calculation?
The same handful of errors show up again and again, and each one is easy to fix once you know to look for it.
- Using base salary instead of a fully loaded rate, which understates every time-saving calculation
- Assuming 100% adoption from day one instead of a phased ramp-up
- Ignoring one-off migration and change management costs
- Double-counting the same saving under two different KPIs
- Excluding manager time saved because it’s harder to track than HR admin time
Fix each one deliberately: apply a 40 to 50% loading on base wages, model adoption in stages (say, 60% by month three, 90% by month nine), list every hidden cost even if small, and build a downside scenario before anyone asks for it.
Pro Tip: Keep a one-page assumptions log alongside your model. When finance asks “where did this number come from” six months later, you’ll have the answer in seconds instead of rebuilding the spreadsheet from memory.

Worked examples: small business and mid-sized organisation
Numbers make this concrete faster than any explanation. Here are two scenarios you can adapt directly.
Small business, 25 employees:
- Baseline: HR admin consumes 15 hours a week at a fully loaded rate of $55/hour. Time-to-hire averages 35 days.
- Expected improvement: software cuts admin time by 40% (6 hours/week saved) and time-to-hire by 20%.
- Annual admin saving: 6 hours × $55 × 52 weeks = $17,160
- Recruitment saving (2 hires/year, faster fill reduces vacancy cost by roughly $1,200 per hire): $2,400
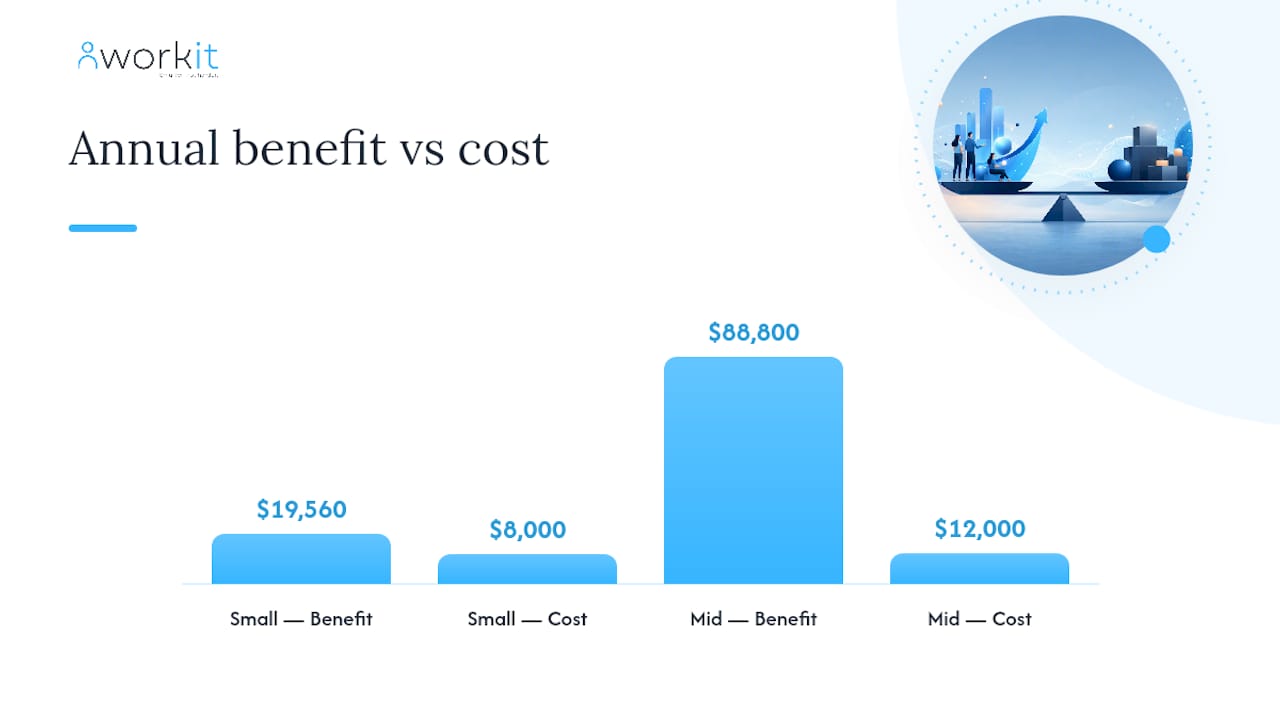
- Total annual benefit: $19,560
- Total annual cost (licence + implementation amortised): $19,560 vs $8,000 platform cost at $5 per employee/month plus a modest setup fee
- Net benefit: $11,560. ROI is often cited as significantly positive in small businesses with moderate savings, with payback periods measured in months.
Mid-sized organisation, 200 employees:
- Baseline: 60 admin hours/week across HR at $60/hour loaded rate, 45 payroll corrections a month at 20 minutes each, time-to-hire of 40 days, onboarding taking 30 days to reach competency.
- Base case assumptions: 35% reduction in admin hours, 50% fewer payroll corrections, onboarding shortened to 20 days.
- Annual admin saving: 21 hours × $60 × 52 = $65,520
- Payroll correction saving: 22 corrections/month recovered × 20 minutes × $60/hour × 12 months ≈ $5,280
- Onboarding productivity gain (10 days faster across ~40 new starters a year, valued conservatively): approximately $18,000
- Total annual benefit: roughly $88,800 against an annual platform cost of $12,000 (200 employees at $5/month). ROI may be very favorable in mid-sized organizations under base assumptions, with payback periods of a few months, though actual results vary widely.
To adapt these to your own organisation, swap in your actual headcount, loaded rate and baseline hours, then run the same formula through your conservative, base and optimistic tabs before you present anything.
How Workit makes HR software ROI easier to measure
Workit is built around the same inputs this article walks through, so the ROI model practically builds itself. Real-time reporting pulls admin hours, onboarding timelines and compliance status into one dashboard instead of scattered spreadsheets, and employee self-service cuts the ticket volume HR teams spend hours chasing every week.
Because pricing is a flat $5 per employee per month with every module included, your total cost of ownership is one line, not a forecast full of add-on guesses. Payroll integration through Xero also reduces the correction time that eats into savings elsewhere in the model.
- Fewer HR admin hours logged per week after rollout
- Shorter onboarding timelines to full productivity
- Cleaner audit trails for compliance reporting
Why most HR software ROI numbers don’t survive the boardroom
Most ROI calculations fail not because the maths is wrong, but because they never account for adoption curves. A spreadsheet that assumes every employee starts using self-service on day one is fiction, and finance teams know it.
The conventional advice tells you to “calculate your ROI” as if it’s a single event. It isn’t. It’s a living model you update at 90 days, six months and a year, because your conservative assumptions from the business case rarely match what actually happens once real employees touch the system.
What the research consistently supports is this: the organisations that get funding approved aren’t the ones with the highest ROI percentage. They’re the ones who show their working, name every assumption, and present a downside scenario nobody asked for. That transparency is what earns trust from a CFO more than an eye-catching headline number ever will.
If you take one thing from this guide, prioritise the fully loaded hourly rate calculation before anything else. Get that number wrong and every other figure in your model inherits the error.
Get a clearer path to measurable HR software ROI
Building an ROI model from scratch means chasing numbers across payroll exports, spreadsheets and half-remembered manager estimates. Workit removes a chunk of that guesswork by keeping admin hours, onboarding timelines and compliance data in one reporting view from day one, so you’re measuring real numbers instead of reconstructing them six months after go-live.
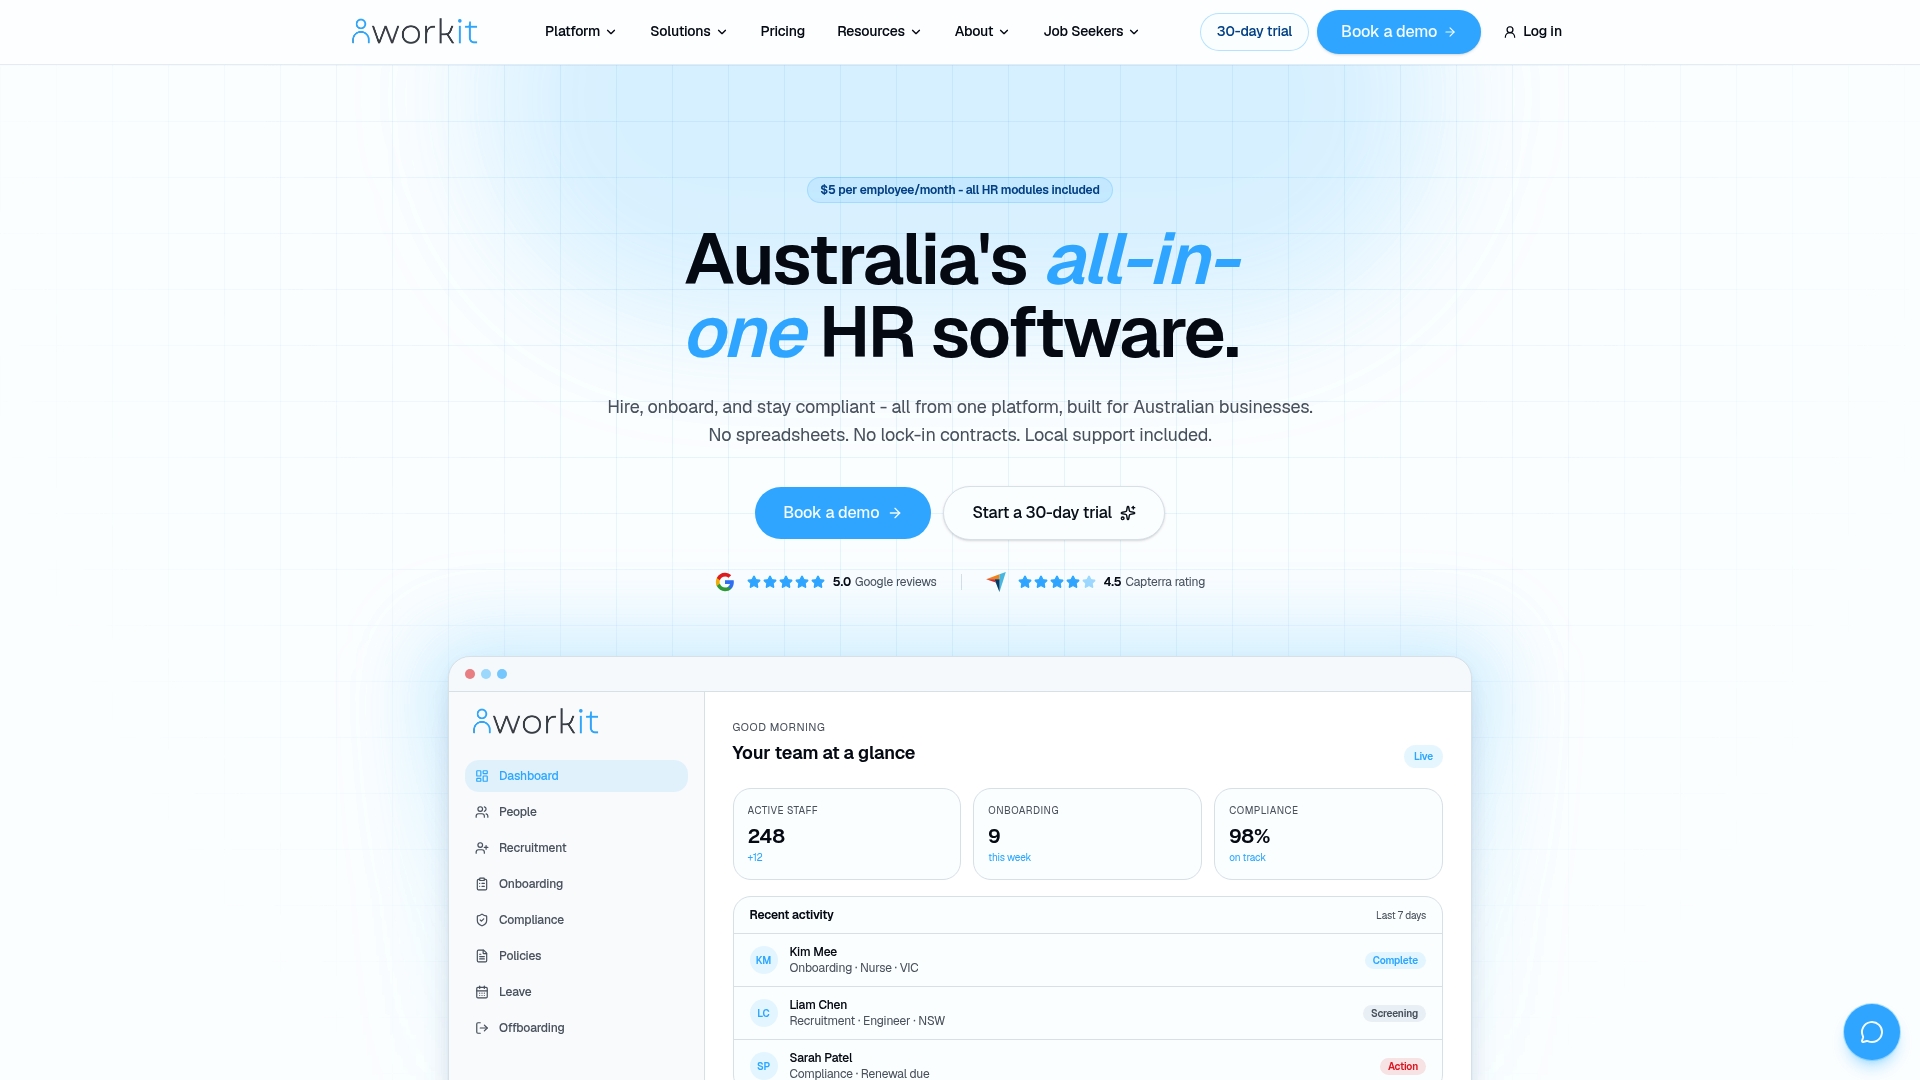
At $5 per employee per month with every module included, your cost side of the ROI equation stays fixed and predictable, no surprise add-on fees to explain away in front of finance. That’s a genuine advantage over platforms that price modules separately and complicate your total cost of ownership calculation before you’ve even started. Local Australian support means when your numbers look off, you’re talking to someone who understands the market, not a support queue in another timezone.
If you’re ready to see what your own numbers could look like, book a demo and bring your baseline data. Workit’s team can walk through how the platform’s reporting would track against the KPIs in your model.
Sources
FAQ
What does ROI mean in HR?
ROI in HR measures the financial return generated by an HR investment relative to its cost, typically expressed as a percentage using the formula (net benefit ÷ total cost) × 100.
How much does HR software typically cost?
Costs vary widely by vendor and pricing model, ranging from per-employee monthly subscriptions to flat enterprise licences; Workit charges a transparent $5 per employee per month covering all modules.
Is a 2% ROI good for HR software?
No, a 2% ROI is well below what most HR technology investments should deliver.
What is the best HR software in Australia?
The right choice depends on your headcount, compliance needs and budget, but Workit is built specifically for Australian businesses with transparent pricing, local support and all HR modules included from onboarding through compliance.
How do I calculate the payback period for HR software?
Divide total cost by average monthly net benefit; most well-run implementations achieve payback within 5 to 18 months depending on organisation size and adoption speed.